Ask someone which state gets the most rain and you will probably hear Florida or Washington. Neither answer is correct. The actual rankings are dominated by states along the Gulf Coast, where the two ingredients needed to produce heavy rainfall consistently come together in the same place at the same time. Those two ingredients are moisture in the atmosphere and some mechanism to force that moisture upward until it condenses into rain. States that top this list have both in abundance. States that lack either one fall toward the bottom, regardless of how close they sit to a major body of water.
The data used here comes from NOAA’s National Centers for Environmental Information, specifically the 1991 to 2020 Climate Normals, which is the most recent standard 30-year period. All values represent statewide area averages, meaning every county in the state, wet and dry alike, contributes to the final number. That methodology is why Hawaii ranks lower than its reputation suggests and why Washington and Oregon end up far down the list despite hosting some of the rainiest cities in the country.
The two ingredients that drive rainfall
Atmospheric moisture comes primarily from evaporation off large bodies of water. Warmer water evaporates more quickly, so the Gulf of Mexico, which is large and warm year-round, functions as the main moisture source for most of the eastern United States. When southerly winds blow across it, they carry vast amounts of water vapor northward. A hygrometer captures the downstream result of this process, measuring the relative humidity and dew point of the air around you, and both values climb noticeably when Gulf moisture floods into a region.
Moisture alone does not produce rain. Air filled with water vapor stays clear indefinitely unless something forces it to rise. As air rises, it expands and cools. Cool it past its dew point and the vapor condenses into cloud droplets, eventually producing precipitation. The main mechanisms that provide this lift are frontal passages, where a cold air mass drives under warm humid air and forces it skyward; orographic lift, where terrain pushes moving air up a mountainside; and surface heating, where warm ground makes the air above it buoyant enough to rise on its own.
States near the Gulf have first access to its moisture supply. States near mountain ranges get reliable orographic lift. States in the path of frequent cold fronts get concentrated bursts of lift throughout the year. The wettest states are the ones where these factors overlap most consistently.
The Gulf Coast Goldilocks zone
Louisiana leads every other state with 59.7 inches of average annual precipitation. The reason comes down to geography. The state sits close enough to the Gulf of Mexico to receive abundant moisture year-round while also sitting directly in the path of cool, dry air masses that surge southeast off the Great Plains. When that colder, denser air runs into the moist Gulf air streaming northward, rain falls in quantity. Louisiana’s wettest month, January, averages 5.7 inches statewide, and even its driest months, September through November, average 4.5 inches each. For comparison, that is more than Seattle’s average monthly rainfall across its own driest season.
The Goldilocks concept is useful here because both Texas and Florida sit lower on this list despite also bordering the Gulf. Texas gets cold air intrusions from the Plains but sits too far west to intercept the richest Gulf moisture streams consistently. Florida has an enormous moisture supply but lacks frequent frontal passages for most of the year, which limits how often that moisture actually falls as rain. Louisiana, Mississippi, and Alabama occupy the zone where both ingredients peak at the same time.
Mississippi ranks second at 58.5 inches and Alabama third at 56.9 inches, both following the same pattern as Louisiana. Moving east along the Gulf Coast means moving slightly farther from the source of the cold Plains air, which reduces the frequency of frontal lifting and brings the totals down modestly without dropping them out of the top tier. Arkansas, ranked sixth at 52.5 inches, sits just north of Louisiana but gets a slightly smaller share of Gulf moisture because prevailing westerly winds push that moisture east rather than straight north through the season.
Monthly precipitation patterns: the top five rainiest states compared
Approximate average monthly precipitation in inches, NOAA Climate Normals 1991–2020
The Appalachian amplifiers
Tennessee ranks fourth at 55.1 inches, North Carolina seventh at 50.8, Georgia eighth at 50.4, and Kentucky ninth at 50.4. All four benefit from orographic lift provided by the Appalachian Mountains. When Gulf moisture flows northward and encounters the western slopes of the Appalachians, the terrain forces that humid air upward, cooling it and producing rain on the windward side. The visible “smoke” of the Great Smoky Mountains in eastern Tennessee is water vapor condensing on those slopes, a direct illustration of the process.
Tennessee benefits from being close enough to the Gulf to receive a steady moisture supply while also having mountain terrain to extract that moisture efficiently. Its precipitation is more seasonal than the states to its south, peaking in winter and early spring when frontal systems are most active, but no month is truly dry. Even October, the driest month in Tennessee on average, sees 3.6 inches statewide.
North Carolina draws moisture from two directions: the Gulf of Mexico to the southwest and the warm Gulf Stream current running along its Atlantic coast. The Gulf Stream keeps offshore sea-surface temperatures elevated well into autumn, feeding passing storm systems and nor’easters moving up the Eastern Seaboard. Georgia and Kentucky end up at exactly the same statewide total of 50.4 inches through different routes. Georgia has closer proximity to Gulf moisture but less exposure to cold air outbreaks from the north. Kentucky has more frequent frontal passages but sits farther from the moisture source. The math comes out the same.
Florida’s wet paradox
Florida ranks fifth at 54.4 inches despite marketing itself as the Sunshine State. The state juts deep into the warm waters of the Gulf of Mexico and subtropical Atlantic, giving it more available atmospheric moisture than almost anywhere in the country. What it lacks, for most of the year, is any mechanism to force that moisture out of the air. There are no mountains, and cold fronts penetrate reliably only in winter.
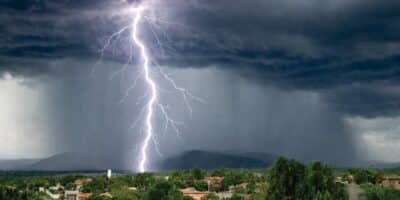
The workaround is the sea breeze. Florida is a peninsula, which means it develops sea breezes along both its Atlantic and Gulf coasts every afternoon as land heats faster than surrounding water. Cool marine air rushes inland from both coasts, and when those opposing flows collide near the center of the state, they push air upward forcefully enough to trigger intense thunderstorms. Tampa and Orlando rank among the most lightning-active cities in the United States because of this mechanism, which runs nearly daily from June through August.
Florida’s precipitation is far more seasonal than any other state in the top ten. The monthly chart above makes this clear. June, July, and August average over seven inches each statewide. November and December average below three inches each. That two-season rhythm reflects Florida’s subtropical position: in summer, a band of tropical thunderstorm activity migrates north to Florida’s latitude and generates prolific rain; in winter, broad high pressure settles over the peninsula and suppresses that activity almost entirely. A state can rank fifth nationally in annual rainfall through an almost entirely different mechanism from the four states ranked above it.
New England’s unlikely showing
Rhode Island and Connecticut, ranked tenth and eleventh at 49.1 and 48.7 inches respectively, are the most geographically surprising entries on this list. Both sit over 1,000 miles from the Gulf of Mexico and neither sits adjacent to particularly warm offshore water in winter. Yet both average more annual rainfall than Georgia, which borders the Gulf Coast region.
The jet stream explains most of it. New England sits directly in the path of the mid-latitude jet stream, particularly in winter and spring, when powerful storm systems can transport Gulf of Mexico and tropical Atlantic moisture thousands of miles northward and deposit it across the region. Rhode Island and Connecticut are small enough that a single intense nor’easter meaningfully raises their seasonal totals. A secondary factor is the Bermuda High, a semi-permanent area of high pressure over the subtropical Atlantic whose clockwise circulation drives moisture-laden southerly winds up the East Coast in summer. When sea breezes or frontal boundaries provide lift against that moisture supply, heavy summer rains become possible far north of what the latitude alone might suggest.
Why Washington and Oregon rank lower than expected
Washington comes in at 27th with 43.2 inches and Oregon at 35th with 32.1 inches, well below where their reputations would place them. Both states are wet on their Pacific-facing slopes and very dry on their eastern sides. The Cascade Range intercepts most incoming Pacific moisture and deposits it as rain and snow on the windward western flanks. By the time that air descends into eastern Washington and eastern Oregon, it has exhausted most of its moisture content. The statewide average reflects both halves. Eastern Washington’s wheat country averages fewer than 10 inches of precipitation per year, pulling the statewide number well down from what a visitor to the coast might expect.
Hawaii presents the same dynamic in a more extreme form, ranking 26th at 43.2 inches. Hilo, on the windward side of the Big Island, records over 126 inches annually, making it one of the rainiest cities in the United States. The leeward sides of the same islands are near-desert. Averaged across the state’s land area, those two extremes produce a number that looks unremarkable.
All 50 states ranked
The chart below ranks all 50 states by average annual precipitation using NOAA’s 1991 to 2020 Climate Normals. The pattern is consistent: the wettest states cluster in the Southeast, near the Gulf moisture supply and the Appalachians. Precipitation drops steadily moving west from the Mississippi River, with the driest states concentrated in the Southwest, where high pressure suppresses rainfall for most of the year and mountain ranges have already extracted Pacific moisture long before it reaches the desert interior.
Average annual precipitation: all 50 states ranked
Source: NOAA National Centers for Environmental Information, Climate Normals 1991–2020. * Hawaii value is an average of five representative locations spanning windward and leeward sides of the islands.